










 +44 20 3885 6670
 意大利Renewable energyL#20261228
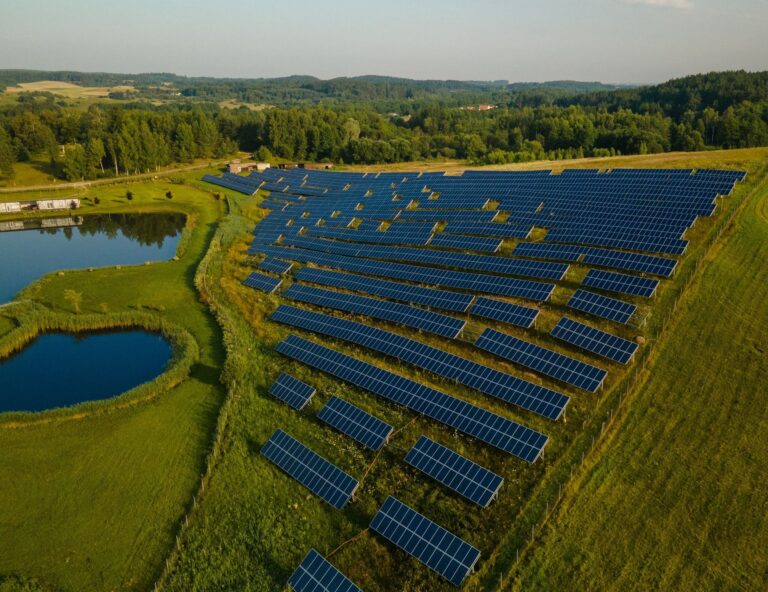
12.73MW Agrivoltaic Solar Project
A 12.73 MWp agrivoltaic solar photovolta…
- 目标价格
- 价格面议
- 营收
- 待定
- EBITDA
- 待公布
 意大利
An integrated analysis of the technical specifications, eleven-year energy generation records, and financial statements outlines a run-of-river hydroelectric facility characterized by high operating margins, operational resilience, and long-term regulatory protection.
River XXXXXXX, Piedmont Region.
Fully owned property.
Works began in March 2013; construction was completed and commercial operations commenced in 2013/2014.
| Key Performance Indicator | 11-Year Cumulative Total | Annual Average | Historical Low (Year) | Historical High (Year) |
| Electricity Generation | 27,164,677 kWh | 2,469,516 kWh | 1,197,964 kWh (2022) | 3,478,239 kWh (2024) |
| Equivalent Full-Load Hours (at 393 kW) | 69,121 hours | 6,284 hours/year | 3,048 hours (2022) | 8,850 hours (2024) |
| Gross Revenue (GSE Tariff) | €5,851,687.05 | €531,971.55 | €257,947.50 (2022) | €750,351.36 (2024) |
| Operating Costs (OPEX) | €1,412,656.76 | €128,423.34 | €67,601.77 (2015) | €219,950.41 (2020) |
| Operating Profit (Revenue − OPEX) | €4,439,030.29 | €403,548.21 | €108,451.93 (2023) | €636,142.03 (2024) |
| Weighted Operating Margin | 75.9% | 73.4% (arithmetic) | 38.0% (2023) | 88.8% (2015) |
| Unit Operating Cost (OPEX / kWh) | €0.052 / kWh | €0.058 / kWh | €0.024 / kWh (2015) | €0.136 / kWh (2023) |
| Year | Generation (kWh) PRODUZIONI CENTRALE (xxxxx) | Revenue (€) RICAVI (xxxxx) | Management Costs (€) RICAVI (xxxxx) | Water Concession Fees (€) RICAVI (xxxxx) | Other Costs & Expenses (€) RICAVI (xxxxx) | Total OPEX (€) RICAVI (xxxxx) | Operating Margin (€) RICAVI (xxxxx) | Margin (%) RICAVI (xxxxx) |
| 2015 | 2,819,258 | 605,487.74 | 47,894.20 | 16,395.96 | 3,311.61 | 67,601.77 | 537,885.97 | 88.8% |
| 2016 | 2,027,190 | 436,327.07 | 82,971.67 | 16,538.54 | 8,212.71 | 107,722.92 | 328,604.15 | 75.3% |
| 2017 | 1,819,266 | 391,149.46 | 58,920.90 | 16,670.89 | 11,407.23 | 86,999.02 | 304,150.44 | 77.8% |
| 2018 | 2,608,331 | 560,783.19 | 80,165.23 | 16,933.54 | 27,007.22 | 124,105.99 | 436,677.20 | 77.9% |
| 2019 | 2,408,867 | 517,763.98 | 99,189.41 | 17,110.54 | 31,647.52 | 147,947.47 | 369,816.51 | 71.4% |
| 2020 | 3,148,017 | 675,802.88 | 180,010.68 | 17,263.91 | 22,675.82 | 219,950.41 | 455,852.47 | 67.5% |
| 2021 | 2,960,853 | 638,539.79 | 86,277.38 | 17,338.91 | 21,970.20 | 125,586.49 | 512,953.30 | 80.3% |
| 2022 | 1,197,964 | 257,947.50 | 68,527.75 | 17,621.96 | 14,653.62 | 100,803.33 | 157,144.17 | 60.9% |
| 2023 | 1,297,811 | 285,562.69 | 136,560.28 | 18,277.96 | 22,272.52 | 177,110.76 | 108,451.93 | 38.0% |
| 2024 | 3,478,239 | 750,351.36 | 74,150.31 | 18,962.19 | 21,096.83 | 114,209.33 | 636,142.03 | 84.8% |
| 2025 | 3,398,881 | 732,985.39 | 102,849.68 | 19,256.19 | 18,493.60 | 140,599.47 | 592,385.92 | 80.8% |
| TOTAL | 27,164,677 | €5,851,687.05 | €1,017,537.49 | €192,370.39 | €202,748.88 | €1,412,656.76 | €4,439,030.29 | 75.9% |
Note: The "Other Costs & Expenses" column combines Occasional Compensations (€24,375.00 total), Mileage Reimbursements (€177,195.56 total), and ARERA Regulatory Contributions (€1,178.32 total).
| 顾问 | Deals |
|---|---|
| MergersCorp M&A International | 21 |
| Keith Advisory | 17 |
| GCG | 9 |
| JP Morgan | 41 |
| Jefferies | 23 |
| Lazard | 26 |
| Goldman Sachs | 30 |
待售企业
意大利Renewable energyL#20261228A 12.73 MWp agrivoltaic solar photovolta…
 意大利Renewable energyL#20261221
An analysis of the operational parameter…
 意大利Renewable energyL#20261209
An attractive investment opportunity inv…
 意大利Renewable energyL#20261208
An opportunity to acquire an operational…
 英国Renewable energyL#20261203
The UK Battery Energy Storage System (BE…
 英国Renewable energyL#20261206
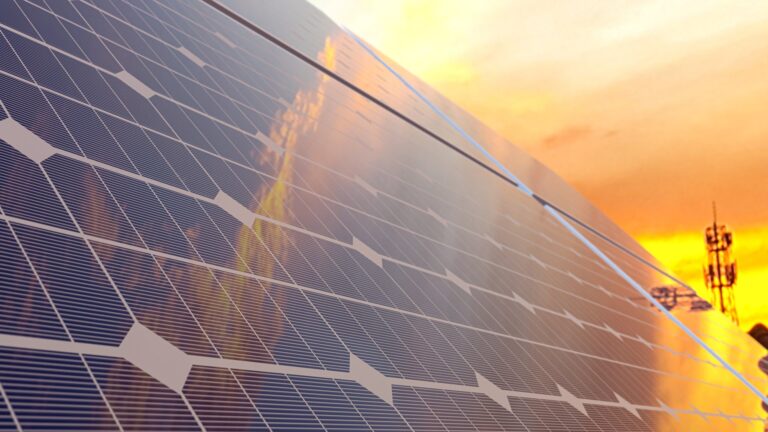
The UK solar energy market continues to …
 英国Renewable energyL#20261204
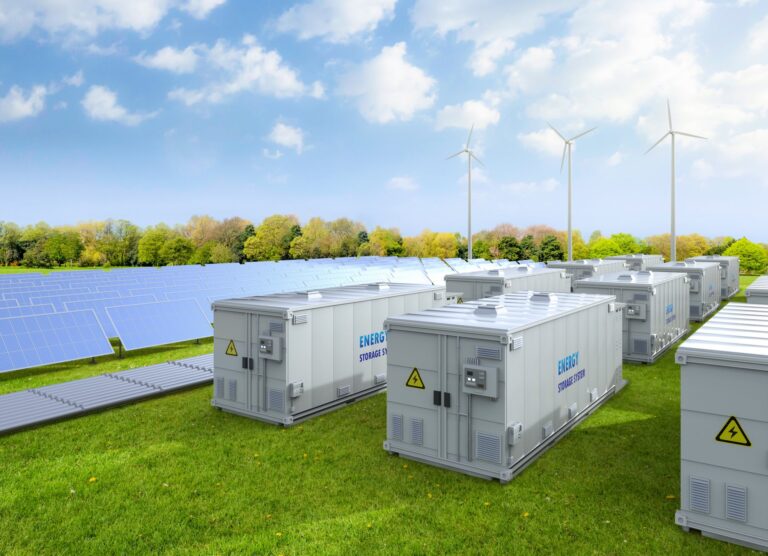
The UK Battery Energy Storage System (BE…
 英国Renewable energyL#20261205
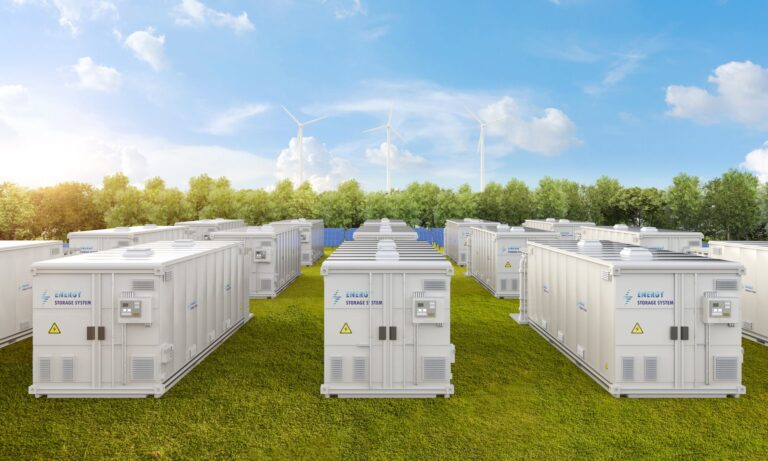
The UK Battery Energy Storage System (BE…